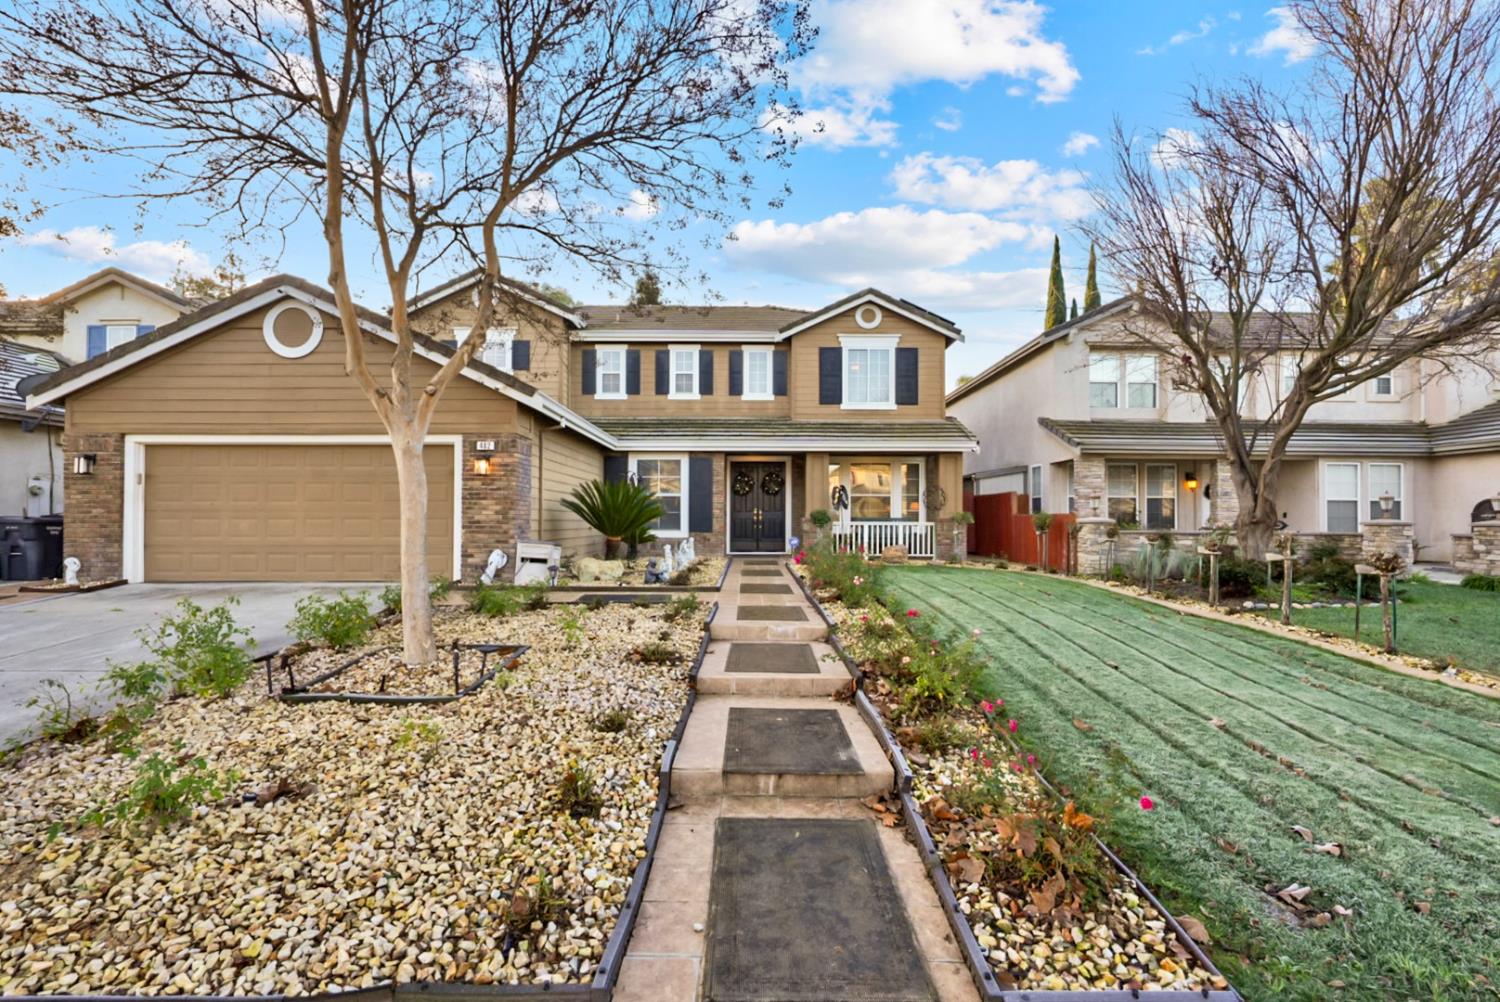
3,148 people live in Glenbriar Estates, where the median age is 40 and the average individual income is $44,363. Data provided by the U.S. Census Bureau.
Total Population
Median Age
Population Density Population Density This is the number of people per square mile in a neighborhood.
Average individual Income
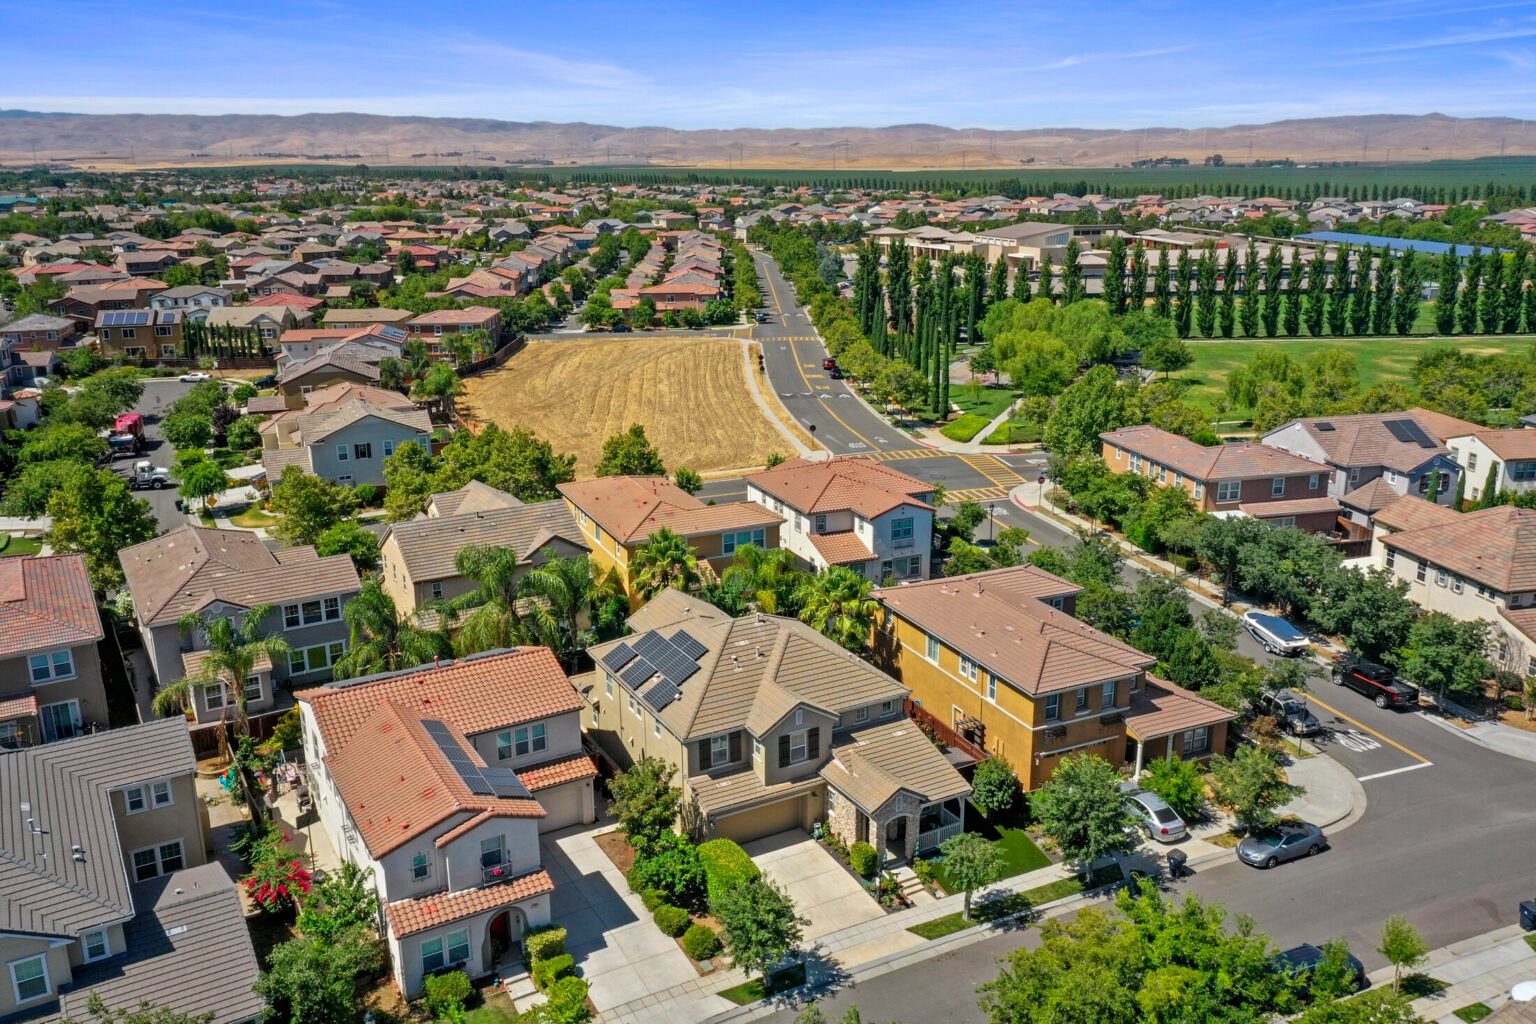
There's plenty to do around Glenbriar Estates, including shopping, dining, nightlife, parks, and more. Data provided by Walk Score and Yelp.
Explore popular things to do in the area, including Tacos El Paco, James Reed's Martial Arts, and The Bar Method -Tracy.
| Name | Category | Distance | Reviews |
Ratings by
Yelp
|
|---|---|---|---|---|
| Dining | 2.7 miles | 12 reviews | 5/5 stars | |
| Active | 0.33 miles | 8 reviews | 5/5 stars | |
| Active | 3.83 miles | 23 reviews | 5/5 stars | |
| Active | 2.1 miles | 5 reviews | 5/5 stars | |
| Beauty | 3.44 miles | 17 reviews | 5/5 stars | |
| Beauty | 2.54 miles | 10 reviews | 5/5 stars | |
| Beauty | 2.41 miles | 7 reviews | 5/5 stars | |
| Beauty | 3.82 miles | 11 reviews | 5/5 stars | |
| Beauty | 2.45 miles | 14 reviews | 5/5 stars | |
| Beauty | 4.35 miles | 5 reviews | 5/5 stars | |
| Beauty | 4.04 miles | 6 reviews | 5/5 stars | |
| Beauty | 2.55 miles | 5 reviews | 5/5 stars | |
|
|
||||
|
|
||||
|
|
||||
|
|
||||
|
|
||||
|
|
Glenbriar Estates has 802 households, with an average household size of 4. Data provided by the U.S. Census Bureau. Here’s what the people living in Glenbriar Estates do for work — and how long it takes them to get there. Data provided by the U.S. Census Bureau. 3,148 people call Glenbriar Estates home. The population density is 16,144.183 and the largest age group is Data provided by the U.S. Census Bureau.
Total Population
Population Density Population Density This is the number of people per square mile in a neighborhood.
Median Age
Men vs Women
Population by Age Group
0-9 Years
10-17 Years
18-24 Years
25-64 Years
65-74 Years
75+ Years
Education Level
Total Households
Average Household Size
Average individual Income
Households with Children
With Children:
Without Children:
Marital Status
Blue vs White Collar Workers
Blue Collar:
White Collar:
A modern real estate experience built on strategy, boutique service, and a connected network of professionals.